10 Reasons Why Tableau is a Game-Changer for Your Business Analytics
In today's fast-paced business environment, making data-driven decisions is crucial for success. But with mountains of data generated daily, businesses often struggle to harness its power effectively. Enter Tableau, a powerful business intelligence (BI) tool designed to help companies visualize and understand their data. Whether you’re an enterprise or a small business, Tableau can be a game-changer. Here’s why:
1. User-Friendly Interface
Tableau's intuitive drag-and-drop interface makes it easy for anyone, from data scientists to business users, to build complex visualizations without needing to write code. This ease of use democratizes data analytics, enabling more people in your organization to leverage insights from data.
2. Stunning Data Visualizations
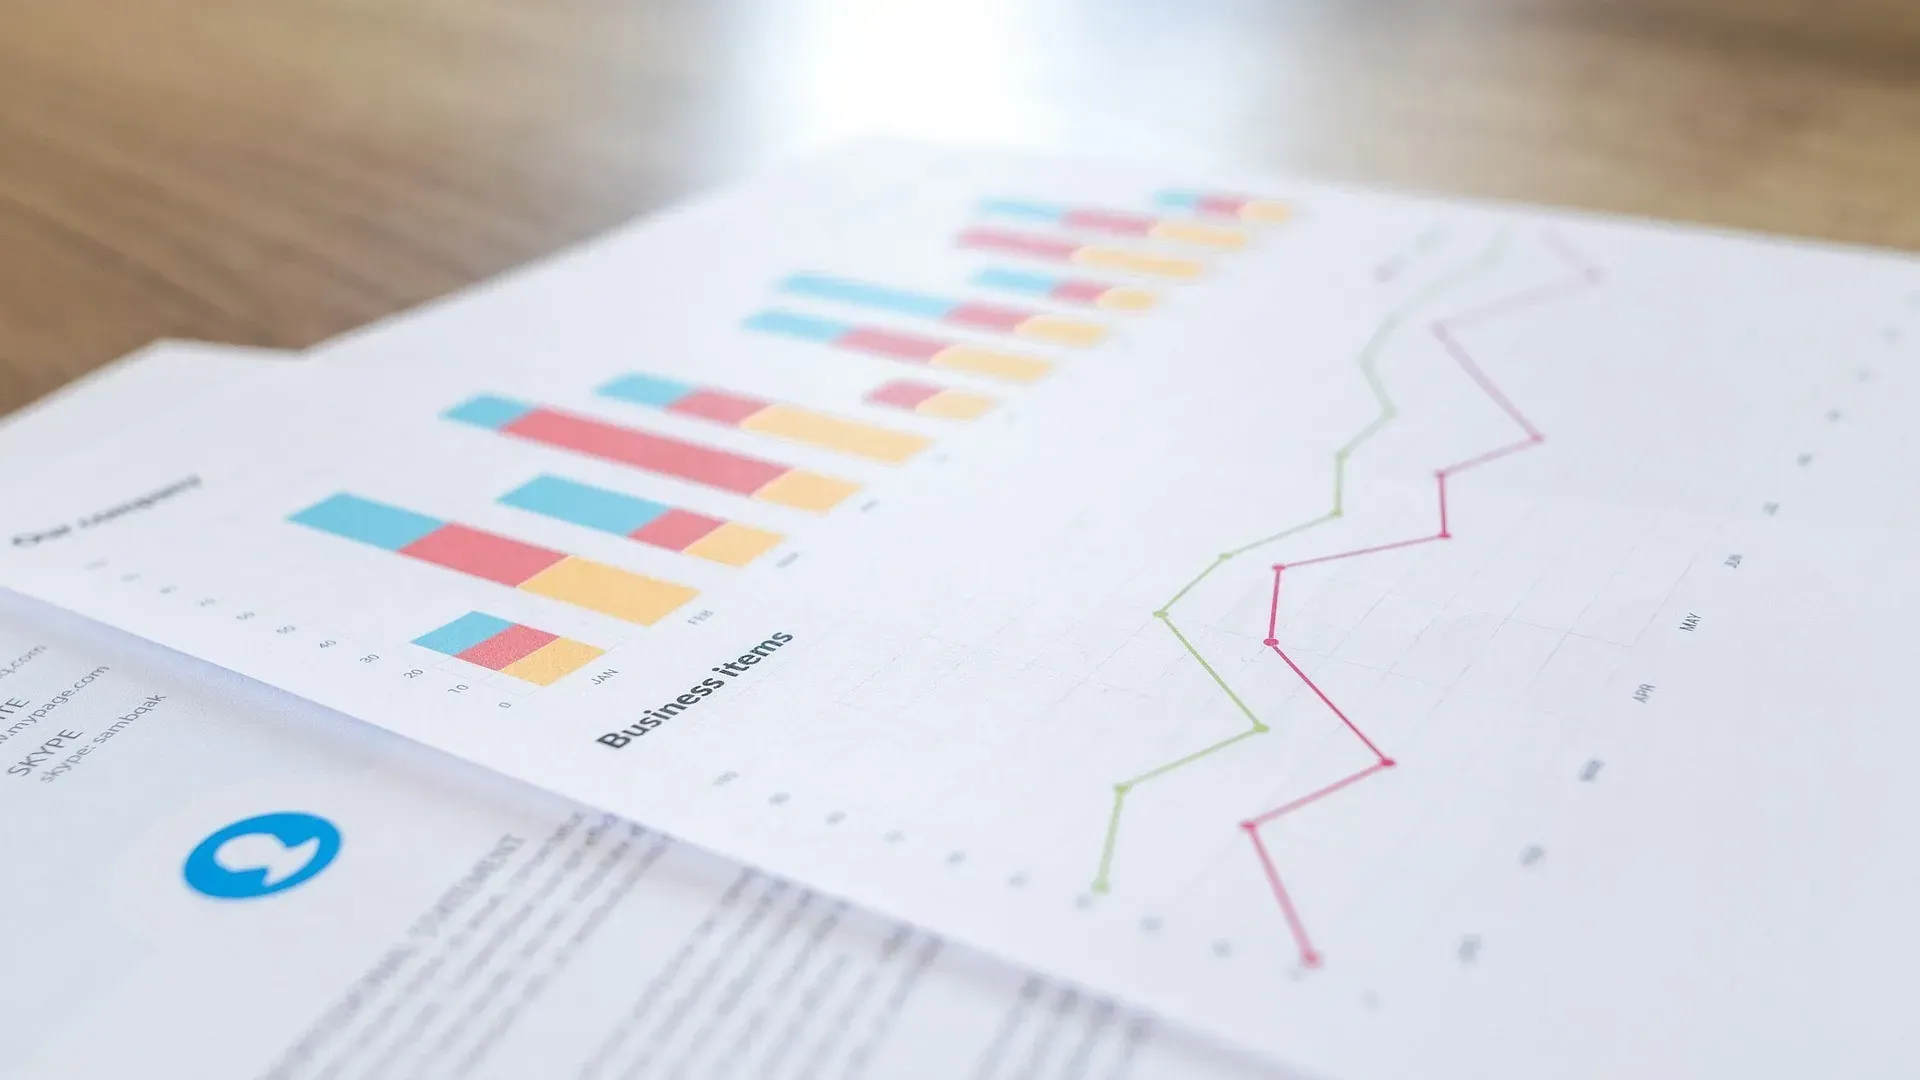
With Tableau, you can transform raw data into stunning, interactive dashboards that are easy to understand and share. Instead of static charts or endless rows of spreadsheets, Tableau offers a dynamic way to present data, helping decision-makers quickly grasp key insights.
3. Real-Time Data Analytic
Tableau allows you to connect to live data sources, ensuring that your dashboards are always up-to-date. Whether you’re tracking sales, monitoring customer feedback, or assessing operational performance, Tableau enables real-time decision-making based on the most current data available.
4. Seamless Integration with Multiple Data Sources
Tableau integrates seamlessly with a wide variety of data sources, including Excel, SQL databases, cloud platforms, and even big data environments like Hadoop. This means you can pull in data from across your organization without worrying about format compatibility or manual data entry.
5. Powerful Data Blending and Joining
One of Tableau’s strongest features is its ability to combine and blend data from different sources easily. This helps you create a holistic view of your business by joining sales data from your CRM with marketing performance from Google Analytics, for example, allowing for more comprehensive analyses.
6. Advanced Analytics Capabilities
Tableau offers advanced analytics features such as trend lines, forecasting, and clustering without requiring complex coding. Its in-built analytics functions enable businesses to identify trends, outliers, and opportunities in real-time, giving you the edge in strategic planning.
7. Collaboration and Sharing
With Tableau’s cloud solutions (Tableau Online and Tableau Server), teams can collaborate on data insights and share dashboards with stakeholders, regardless of their location. This promotes transparency and ensures everyone is working with the same data set, fostering a unified, data-driven culture.
8. Mobile-Friendly Dashboards
In today’s mobile-driven world, access to data on the go is crucial. Tableau provides fully responsive dashboards that work seamlessly on mobile devices. Whether your team is in the office or out in the field, Tableau ensures that vital business insights are always at your fingertips.
9. Scalability and Flexibility
Whether you're a small business analyzing data from a few dozen rows or a global enterprise working with millions of data points, Tableau scales with you. It’s flexible enough to meet the needs of a growing business without sacrificing performance, making it an ideal tool for businesses of any size.
10. Constant Innovation
Tableau is known for its continuous innovation and frequent updates. With each release, Tableau introduces new features and capabilities that further enhance its utility for businesses. From improved AI integration to enhanced natural language processing (NLP) features, Tableau keeps evolving to meet the demands of the modern business landscape.
Tableau isn’t just another BI tool—it’s a powerful platform that transforms how businesses approach data analytics. Its ability to create visually appealing, interactive dashboards, connect to multiple data sources, and provide real-time insights sets it apart from competitors. Whether you're looking to gain deeper insights into your data or make faster, more informed decisions, Tableau can be the key to unlocking your business’s full potential.
Ready to Transform Your Business Analytics? At Arctic Analytx, we specialize in helping businesses implement Tableau for game-changing insights. Contact us today to learn how Tableau can revolutionize your data strategy.


